Log reduction measures how much a disinfection process cuts the number of live microbes on a surface, counted in powers of ten. Each log is a tenfold drop: 1-log removes 90 percent and 6-log removes 99.9999 percent, so a "99.999%" claim is a 5-log reduction. The catch is the test condition that produced the number.
You have seen the numbers on every disinfection data sheet: 99.9 percent, 99.999 percent, a "6-log kill." Log reduction is the shorthand behind all of them, and as arithmetic it is precise. What the figure does not tell you on its own is the condition that produced it, and that condition is what separates a marketing headline from a result you can plan an infection-prevention programme around. This guide decodes the math plainly, then does the more useful job: showing what those numbers realistically mean for UV-C on the surfaces in an actual room. For the underlying mechanism, see our explainer on how UV-C disinfection works.
What is a log reduction?
A log reduction is the base-10 logarithm of the ratio between the microbes you started with and the microbes that survive.1 In plain terms, it counts how many times you have divided the population by ten.
If a surface carried 1,000,000 colony-forming units and a process left 1,000, the count fell by a factor of 1,000, or three tens multiplied together, so that is a 3-log reduction. The formula is log₁₀(N₀ ÷ N), where N₀ is the starting count and N is the survivors. Every step up by one whole log is another tenfold cut, not a small increment on the last one. That single fact, one log equals one factor of ten, is the key to reading every claim that follows.
What does each log really remove?
The percentages and the logs are two ways of saying the same thing. For a whole-number log, the shortcut is that the percentage has that many nines: 3-log is three nines, 99.9 percent; 5-log is five nines, 99.999 percent.1 The table below shows every step, with the survivors left from a starting population of one million.
| Log reduction | Percent reduction | Fraction surviving | From 1,000,000 CFU, survivors |
|---|---|---|---|
| 1-log | 90% | 1 in 10 | 100,000 |
| 2-log | 99% | 1 in 100 | 10,000 |
| 3-log | 99.9% | 1 in 1,000 | 1,000 |
| 4-log | 99.99% | 1 in 10,000 | 100 |
| 5-log | 99.999% | 1 in 100,000 | 10 |
| 6-log | 99.9999% | 1 in 1,000,000 | 1 |
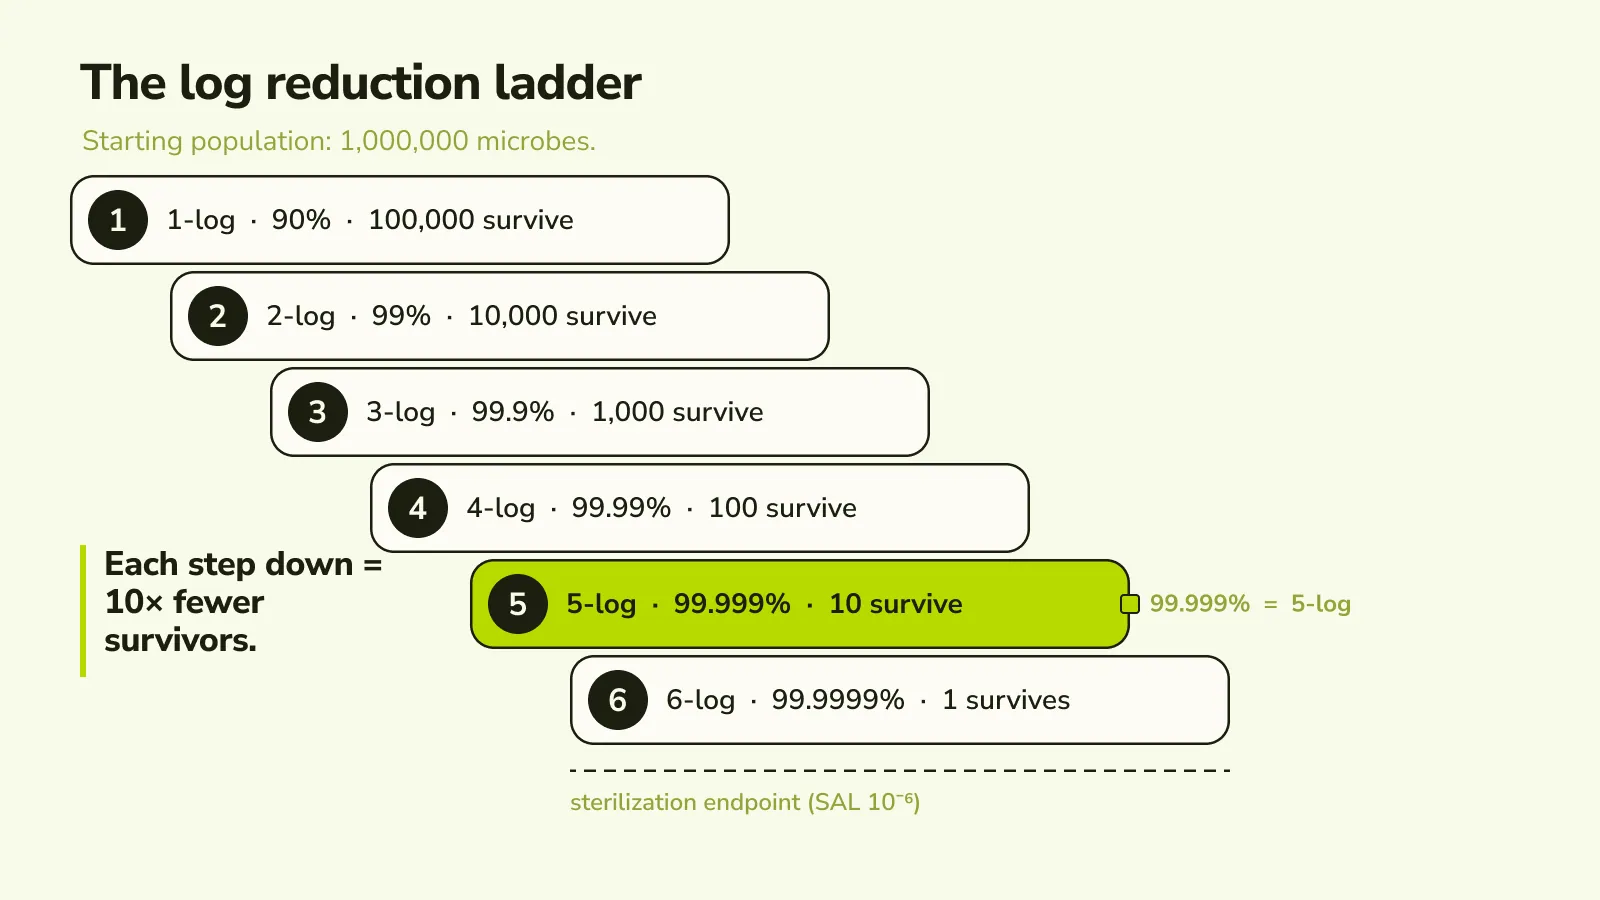
The important thing the ladder makes visible: the difference between 99.9 percent and 99.99 percent is not "a bit more." It is ten times fewer survivors. Each nine you add asks the process to do ten times as much work as the nine before it. That is why the gap between a 3-log and a 6-log claim is enormous, even though the two numbers look almost identical on a page.
Why do the last logs cost the most dose?
For a light-based process like UV-C, every log you gain has a price in delivered energy, and the price rises as you climb.
The dose that inactivates 90 percent of an organism, one log, has a name: the decimal-reduction dose, often written D90.2 Under ideal single-hit conditions the survival curve is log-linear, so each log costs roughly the same extra dose. In practice two things bend that clean line. Many organisms show a shoulder, a slow start where the first dose does less than expected, and most show tailing, a resistant fraction at the end that flattens the curve.2 Tailing is why the last logs are the hardest to buy: the survivors at 99.999 percent are disproportionately the toughest cells, and clearing them takes far more dose than clearing the easy majority did at the start.
So when you compare a 4-log claim with a 6-log claim, the extra two logs are not a small step up. They can represent a much larger jump in dose, exposure time, or proximity to the lamp.
Where does a log number actually come from?
Here is the part the data sheet rarely prints. A stated log reduction is not a property of a device in the abstract. It is a measurement taken under a defined test, on a defined surface, against a defined organism.
Regulated efficacy claims are earned on inoculated carriers, small coupons seeded with a known count of microbes and then exposed under controlled geometry. The modern quantitative surface method, ASTM E2197, inoculates a brushed-steel disk about a centimetre across, exposes it, and measures the log₁₀ reduction directly.3 Older disinfectant registration tests such as the AOAC use-dilution method are not even reported as a log value; they are qualitative pass-or-fail on steel carriers, so "registered disinfectant" does not by itself name a number.4
The threshold a product must clear also depends on the claim class. A U.S. EPA disinfectant is expected to destroy the bacteria and fungi named on its label but not necessarily their spores, while a sanitizer only reduces microbes to a safe level rather than eliminating them.5 For a sanitizer the numeric bar depends on the surface: a non-food-contact sanitizer must reach 3-log, 99.9 percent, within five minutes, while the headline food-contact "5-log in 30 seconds" figure is a stricter food-contact sanitizing-rinse specification, not a universal guarantee.6 The number is real; the fine print is the condition that produced it.
What does "99.999%" really imply, and what does it not?
It helps to know the ceiling those numbers point toward. A 6-log reduction, 99.9999 percent, sits at the boundary of sterilization language. The formal sterility endpoint for a device labelled "sterile" is a Sterility Assurance Level of 10⁻⁶, meaning no more than a one-in-a-million probability that a single microorganism survives.7 That is demonstrated by validation for terminally sterilized, sealed products, and it is a probability target, not a routine surface reading.
So a "6-log" or "99.9999%" headline describes either an ideal inoculated coupon or a sterilization-grade endpoint, not the everyday performance of surface disinfection across every surface in a room. Disinfection reduces the microbial load to a safe level; sterilization removes essentially all viable microbes. They are different jobs with different endpoints, and the distinction matters when a number is read by a skeptical eye.
What does UV-C actually deliver on room surfaces?
A coupon is not a room, and this is where the honest reading of UV-C lives. Measured logs are strong when a surface is close to the lamp and in direct line of sight. They fall, sometimes sharply, with distance, shadow, and residual soil.
The clearest illustration comes from a 2016 study by Boyce and colleagues, which measured the same mobile UV-C device from one fixed position. On directly exposed surfaces it inactivated MRSA and VRE by more than 4-log; on shaded surfaces in the same room the reduction fell to roughly 1 to 3-log, and for Clostridioides difficile spores it dropped from more than 2 to 3-log in direct view to essentially zero in shadow within a five-minute cycle, as the delivered dose fell by nearly ninetyfold from near to far.8 Rutala and colleagues found vegetative bacteria reached more than 3-log in about 15 minutes, while spores needed close to 50 minutes to reach 99.8 percent.9 And a log measured at close range is not the log at distance: at 10 feet, direct exposure gave only up to 3-log against MRSA and VRE and under 2-log against C. difficile spores.10
The measured number also shifts with how you test. In a study by Cadnum and colleagues, the same device's result changed with how the inoculum was spread, how the carrier was oriented to the lamps, its height, and the organic load present.11 Test-method variation alone significantly moved the reported reduction, the cleanest evidence that a marketing "X-log" is partly a lab-condition artifact. A clean coupon in ideal geometry flatters; room geometry and residual soil do not.
Why do bacterial spores cap the number?
Spores are the reason a single high log claim rarely holds for everything in a room. The spore of C. difficile wraps its DNA in protective proteins, dehydrates it, and forms a UV-resistant lesion called the spore photoproduct, so it needs a far higher dose than a virus or a vegetative bacterium.12 Lowering the delivered dose causes spore kill to fall first.13 The honest position is that spores are the dose-limited organism, and a routine cycle should be described as reducing them, not as having "eliminated" or "proven kill" against them.
So how should you read a UV-C efficacy claim?
Treat every UV-C surface log as what it is: a value measured on an inoculated coupon at a stated distance and orientation, under a stated dose, against a stated organism. That framing is not a weakness. It is the difference between a claim that survives scrutiny and one that does not.
What matters clinically is not the largest number on the sheet but the outcome the technology contributes to. The BETR-D multicentre randomised trial found that adding UV-C to standard terminal cleaning was associated with about a 30 percent lower rate of acquiring key multidrug-resistant organisms, with the benefit clear for that grouped outcome and not statistically significant for C. difficile on its own.14 A modest, attributed reduction in acquisition is the credible headline, not a coupon "99.999%."
This is also why UV-C is a no-touch adjunct after manual cleaning, never instead of it. Light cannot lift organic soil, and it only reaches what it can see, so national guidance is consistent that physical cleaning comes first and no-touch technologies supplement it.1516 When ROZOR reports efficacy, it reports it that way: the organism, the dose, and the test condition behind any figure, with UV-C as the consistent extra pass on top of a sound cleaning programme, not a replacement for it.
See how the ROZOR Disinfection Robot puts this to work. It delivers no-touch UV-C disinfection as an adjunct to your cleaning programme, physical AI for critical environments. Learn more about the ROZOR Disinfection Robot.
Frequently asked questions
What does a 6-log reduction mean?
A 6-log reduction is a 99.9999 percent cut in the number of viable microbes, leaving about 1 survivor for every 1,000,000 you started with. It sits at the edge of sterilization-grade performance and is typically an ideal-coupon or sterilization endpoint, not a routine surface result.
Is a 99.999% claim the same as sterilization?
No. 99.999 percent is a 5-log reduction. Sterilization is defined by a Sterility Assurance Level of 10 to the minus 6, a one-in-a-million probability of survival demonstrated by validation on sealed products. Surface disinfection reduces the microbial load to a safe level; it does not sterilize.
What log reduction does UV-C achieve on surfaces?
It depends on dose, distance, line of sight, and the organism. Directly exposed vegetative bacteria can reach more than 3 to 4-log, while shaded surfaces and spores in the same cycle can see far less, sometimes close to zero. A single room-wide log figure is not deliverable to every surface.
Does UV-C eliminate C. difficile spores?
Spores are the hardest target and are dose-limited, so a routine cycle reduces them rather than eliminating them. Read any spore claim as a reduction under a stated dose, not a guarantee.
Is a higher log reduction always better?
A higher log is better only if it was measured under conditions that resemble your surfaces. Each extra log costs disproportionately more dose because of tailing, so a very high number often signals ideal lab geometry rather than room performance. Ask what dose, distance, and test produced it.
Sources
- Microchem Laboratory. "Log and Percent Reductions in Microbiology and Antimicrobial Testing." https://microchemlab.com/information/log-and-percent-reductions-microbiology-and-antimicrobial-testing/
- Kowalski W. "Ultraviolet Germicidal Irradiation Handbook: UVGI for Air and Surface Disinfection." Springer, 2009. https://doi.org/10.1007/978-3-642-01999-9
- Microchem Laboratory. "ASTM E2197 Quantitative Disk Carrier Test." https://microchemlab.com/test/astm-e2197-quantitative-disk-carrier-test/
- Microchem Laboratory. "AOAC Use-Dilution Method (AOAC 955.14 / 955.15 / 964.02)." https://microchemlab.com/test/aoac-use-dilution-test-aoac-95514-95515-96402/
- U.S. Environmental Protection Agency. "What are Antimicrobial Pesticides?" https://www.epa.gov/pesticide-registration/what-are-antimicrobial-pesticides
- U.S. Environmental Protection Agency, Office of Chemical Safety and Pollution Prevention. "Product Performance Test Guidelines OCSPP 810.2300: Sanitizers for Use on Hard Surfaces" (September 2012). https://www.epa.gov/test-guidelines-pesticides-and-toxic-substances/series-810-product-performance-test-guidelines
- Sterility Assurance Level (SAL 10^-6). ScienceDirect Topics: engineering overview of the FDA/AAMI/ISO sterility endpoint. https://www.sciencedirect.com/topics/engineering/sterility-assurance-level
- Boyce JM, Farrel PA, Towle D, Fekieta R, Aniskiewicz M. "Impact of room location on UV-C irradiance and UV-C dosage and antimicrobial effect delivered by a mobile UV-C light device." Infection Control & Hospital Epidemiology, 2016; 37(6):667-672. https://doi.org/10.1017/ice.2016.35
- Rutala WA, Gergen MF, Weber DJ. "Room decontamination with UV radiation." Infection Control & Hospital Epidemiology, 2010; 31(10):1025-1029. https://doi.org/10.1086/656244
- Nerandzic MM, Fisher CW, Donskey CJ. "Sorting through the wealth of options: comparative evaluation of two ultraviolet disinfection systems." PLOS ONE, 2014; 9(9):e107444. https://doi.org/10.1371/journal.pone.0107444
- Cadnum JL, Tomas ME, Sankar T, et al. "Effect of variation in test methods on performance of ultraviolet-C radiation room decontamination." Infection Control & Hospital Epidemiology, 2016; 37(5):555-560. https://doi.org/10.1017/ice.2015.349
- Setlow P. "Photochemistry and Photobiology of the Spore Photoproduct: A 50-Year Journey." Photochemistry and Photobiology, 2015; 91(6):1263-1290. https://doi.org/10.1111/php.12506
- Nerandzic MM, Cadnum JL, Pultz MJ, Donskey CJ. "Evaluation of an automated ultraviolet radiation device for decontamination of Clostridium difficile and other healthcare-associated pathogens in hospital rooms." BMC Infectious Diseases, 2010; 10:197. https://doi.org/10.1186/1471-2334-10-197
- Anderson DJ, Chen LF, Weber DJ, et al. "Enhanced terminal room disinfection and acquisition and infection caused by multidrug-resistant organisms and Clostridium difficile (the BETR-D study): a cluster-randomised, multicentre, crossover study." The Lancet, 2017; 389(10071):805-814. https://doi.org/10.1016/S0140-6736(16)31588-4
- Weber DJ, Rutala WA, Anderson DJ, Sickbert-Bennett EE. "No touch methods for health care room disinfection: focus on clinical trials." American Journal of Infection Control, 2023; 51(11S):A134-A143. https://doi.org/10.1016/j.ajic.2023.04.003
- Rutala WA, Weber DJ, and the Healthcare Infection Control Practices Advisory Committee (HICPAC). "Guideline for Disinfection and Sterilization in Healthcare Facilities, 2008" (updated). U.S. Centers for Disease Control and Prevention. https://www.cdc.gov/infection-control/media/pdfs/guideline-disinfection-h.pdf